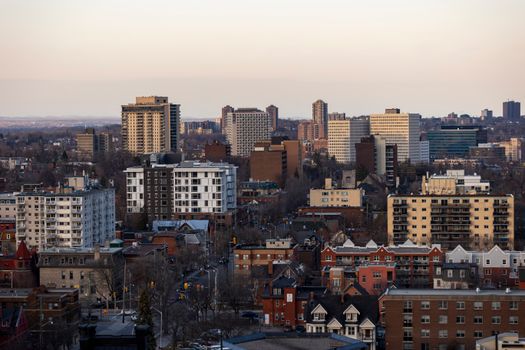
Ottawa occupies a distinct position in Canada's housing affordability conversation. It is not the crisis market that Toronto and Vancouver represent, nor is it the bargain destination of Winnipeg or Regina. Understanding where Ottawa sits relative to other major Canadian cities is essential context for anyone evaluating whether to buy here.
Benchmark Price Comparisons, Early 2026
According to CREA data, benchmark home prices across Canada's major markets tell a clear story. Greater Toronto Area benchmark: $1,068,000. Vancouver: $1,172,000. Ottawa: $672,000. Calgary: $594,000. Edmonton: $436,000. Montreal: $548,000. Winnipeg: $368,000. Ottawa sits meaningfully above the Prairie markets and Montreal but 37% below Toronto and 43% below Vancouver on a benchmark basis.
Income-to-Price Ratios
National Bank of Canada's Housing Affordability Monitor calculates that an Ottawa household needs 4.2 years of pre-tax median household income to cover a 20% down payment on a benchmark home, compared to 9.3 years in Toronto and 11.4 years in Vancouver. By this measure, Ottawa remains one of Canada's more attainable major markets, though significantly less affordable than it was in 2019 when the ratio was 2.8.
The Public Sector Advantage
Ottawa's affordability picture is also distorted by its income base. Federal government workers earn median salaries of $88,000 to $105,000 depending on classification, compared to national private-sector medians around $62,000. This income advantage relative to local housing prices makes Ottawa genuinely more accessible to its own workforce than raw price comparisons suggest.
Mortgage Carrying Costs
With a benchmark home at $672,000, a 20% down payment of $134,400, and a 5-year fixed rate of 4.6%, monthly principal and interest payments come to approximately $2,940. Adding property taxes of roughly $480/month and estimated maintenance of $300/month brings total carrying cost to about $3,720/month, affordable for dual-income federal government households but stretching for single-income buyers.
The Long-Term Stability Case
Ottawa has never experienced Toronto's or Vancouver's speculative excess, but it also lacks their liquidity and resale depth. The tradeoff is stability: Ottawa's worst correction was 16% from peak to trough in 2022–2024, while Toronto saw 22% and some Vancouver segments dropped 28%. For buyers prioritizing capital preservation, Ottawa's affordability combined with its stable employment base makes a compelling case that no amount of raw price comparison can fully capture.